Accessing data later, after the measurement#
From APS Python Training for Bluesky Data Acquisition.
Objective
Get the data from previous run(s) and work with it.
Skip the instrument package#
There is no need to import the instrument package since we won’t measure anything in this notebook.
Access the database#
In the instrument package (in file instrument/framework/initialize.py), we connected databroker with the MongoDB server using the class_2021_03 catalog. Get that catalog now. We’ll need to import some tools first.
[1]:
from apstools.utils import listruns, quantify_md_key_use
import databroker
from databroker.queries import TimeRange

db = databroker.catalog["training"]
listruns()
catalog: training
[1]:
| scan_id | time | plan_name | detectors | |
|---|---|---|---|---|
| 0 | 4 | 2021-08-19 14:03:33 | scan | [vsc16] |
| 1 | 3 | 2021-08-19 14:03:10 | scan | [vsc16] |
| 2 | 2 | 2021-08-19 14:02:58 | scan | [vsc16] |
| 3 | 1 | 2021-08-19 14:02:41 | scan | [vsc16] |
| 4 | 39 | 2021-08-19 13:39:12 | scan | [noisy] |
| 5 | 38 | 2021-08-19 11:45:29 | scan | [scaler1] |
| 6 | 37 | 2021-08-19 11:40:40 | scan | [noisy] |
| 7 | 36 | 2021-08-19 11:39:38 | scan | [noisy] |
| 8 | 4 | 2021-08-19 11:04:45 | scan | [vsc16] |
| 9 | 3 | 2021-08-19 11:04:08 | scan | [vsc16] |
| 10 | 2 | 2021-08-19 11:00:56 | scan | [vsc16] |
| 11 | 1 | 2021-08-19 10:58:39 | scan | [vsc16] |
| 12 | 2 | 2021-08-19 10:57:09 | scan | [vsc16] |
| 13 | 1 | 2021-08-19 10:53:19 | scan | [vsc16] |
| 14 | 35 | 2021-04-13 12:19:15 | count | [temperature] |
| 15 | 34 | 2021-04-13 12:18:54 | count | [temperature] |
| 16 | 33 | 2021-04-13 12:18:51 | count | [temperature] |
| 17 | 32 | 2021-04-13 12:18:51 | count | [temperature] |
| 18 | 31 | 2021-04-11 14:15:20 | count | [temperature] |
| 19 | 30 | 2021-04-11 14:14:58 | count | [temperature] |
Our temperature count measurement is one of those listed, but which one? Recall how we started our run: RE(bp.count([temperature], num=50, delay=0.1, md={"motive": "tscan"})).
In case some other type of run is more recent, we’ll search for the most recent run with this metadata. First, find any recent (since Feb 2021) runs with this metadata. We need to do this search with the v2 version of databroker catalogs. The result of the search is another catalog.
[2]:
cat = db.v2.search(TimeRange(since="2021-02-02")).search({"motive": "tscan"})
print(f"Search for runs with motive='tscan' metadata found {len(cat)} run(s).")
Search for runs with motive='tscan' metadata found 5 run(s).
Show the run’s metadata.
[3]:
if len(cat):
    run = cat[-1]
else:
    raise KeyError("No runs found with `motive='tscan'`")

run.metadata
[3]:
{'start': Start({'beamline_id': 'APS EPICS/Python/Bluesky training VM',
 'detectors': ['temperature'],
 'hints': {'dimensions': [[['time'], 'primary']]},
 'instrument_name': 'training',
 'login_id': 'apsu@apsu-sim',
 'motive': 'tscan',
 'notebook': 'watch_temperature',
 'num_intervals': 49,
 'num_points': 50,
 'pid': 3432,
 'plan_args': {'detectors': ["MyPvPositioner(prefix='gp:userCalc8', "
                             "name='temperature', settle_time=0.0, "
                             "timeout=None, read_attrs=['setpoint', "
                             "'readback'], configuration_attrs=['calculation', "
                             "'description', 'max_change', 'noise', "
                             "'previous_value_pv', 'scanning_rate', "
                             "'tolerance'], limits=(-20, 255), egu='C')"],
               'num': 50},
 'plan_name': 'count',
 'plan_type': 'generator',
 'proposal_id': 'training-2021-04',
 'scan_id': 35,
 'time': 1618334355.5878208,
 'uid': 'c0bbb846-43ae-46c2-b9e4-319a4c162812',
 'versions': {'apstools': '1.5.0',
              'bluesky': '1.6.7',
              'databroker': '1.2.3',
              'epics': '3.4.3',
              'h5py': '2.10.0',
              'intake': '0.6.2',
              'matplotlib': '3.3.4',
              'numpy': '1.19.2',
              'ophyd': '1.6.1',
              'pyRestTable': '2020.0.3',
              'spec2nexus': '2021.1.8'}}),
 'stop': Stop({'exit_status': 'success',
 'num_events': {'baseline': 2, 'primary': 50},
 'reason': '',
 'run_start': 'c0bbb846-43ae-46c2-b9e4-319a4c162812',
 'time': 1618334361.5295637,
 'uid': '38f1deba-2c64-4faf-a0b7-30a50c6869ca'}),
 'catalog_dir': None}
Read the primary data stream of the run#
[4]:
dataset = run.primary.read()
[5]:
dataset
[5]:
<xarray.Dataset>
Dimensions:               (time: 50)
Coordinates:
  * time                  (time) float64 1.618e+09 1.618e+09 ... 1.618e+09
Data variables:
    temperature_setpoint  (time) float64 35.0 35.0 35.0 35.0 ... 35.0 35.0 35.0
temperature (time) float64 34.89 35.01 35.19 ... 35.02 34.62 35.38- time: 50
- time(time)float641.618e+09 1.618e+09 ... 1.618e+09
array([1.618334e+09, 1.618334e+09, 1.618334e+09, 1.618334e+09, 1.618334e+09,
       1.618334e+09, 1.618334e+09, 1.618334e+09, 1.618334e+09, 1.618334e+09,
       1.618334e+09, 1.618334e+09, 1.618334e+09, 1.618334e+09, 1.618334e+09,
       1.618334e+09, 1.618334e+09, 1.618334e+09, 1.618334e+09, 1.618334e+09,
       1.618334e+09, 1.618334e+09, 1.618334e+09, 1.618334e+09, 1.618334e+09,
       1.618334e+09, 1.618334e+09, 1.618334e+09, 1.618334e+09, 1.618334e+09,
       1.618334e+09, 1.618334e+09, 1.618334e+09, 1.618334e+09, 1.618334e+09,
       1.618334e+09, 1.618334e+09, 1.618334e+09, 1.618334e+09, 1.618334e+09,
       1.618334e+09, 1.618334e+09, 1.618334e+09, 1.618334e+09, 1.618334e+09,
       1.618334e+09, 1.618334e+09, 1.618334e+09, 1.618334e+09, 1.618334e+09])
- temperature_setpoint(time)float6435.0 35.0 35.0 ... 35.0 35.0 35.0
- object :
- temperature
array([35., 35., 35., 35., 35., 35., 35., 35., 35., 35., 35., 35., 35., 35., 35., 35., 35., 35., 35., 35., 35., 35., 35., 35., 35., 35., 35., 35., 35., 35., 35., 35., 35., 35., 35., 35., 35., 35., 35., 35., 35., 35., 35., 35., 35., 35., 35., 35., 35., 35.]) - temperature(time)float6434.89 35.01 35.19 ... 34.62 35.38
- object :
- temperature
array([34.8896849 , 35.01305409, 35.19233234, 35.0216907 , 35.43205158,
       34.5056611 , 35.37074083, 34.51771572, 34.85019455, 34.82137026,
       35.3455024 , 34.82780957, 35.21680781, 34.54200809, 35.08982223,
       34.87608911, 35.03902495, 35.00504311, 35.42178225, 34.76303502,
       34.91893645, 34.9121767 , 34.5496376 , 34.78567941, 34.63224994,
       35.42848096, 35.0320058 , 35.24485389, 35.22823682, 35.06241703,
       34.86455329, 34.54406806, 35.24770733, 34.91025406, 34.60228122,
       35.48713664, 34.94979019, 35.21024643, 34.94386969, 35.1342565 ,
       35.12812238, 34.58931106, 34.60415808, 35.36431678, 34.6698024 ,
       34.99550622, 35.29185168, 35.02181277, 34.61917296, 35.3817731 ])
Let’s get the values as a 1-D numpy array.
[6]:
T = dataset["temperature"].values
Compute the statistics#
Use the methods of numpy arrays to compute maximum, mean, standard deviation, and minimum. Looks nicer in a table.
[7]:
import pyRestTable

table = pyRestTable.Table()
table.addLabel("measure")
table.addLabel("value")
table.addRow(("max", T.max()))
table.addRow(("mean", T.mean()))
table.addRow(("dev", T.std()))
table.addRow(("min", T.min()))
table.addRow(("#", len(T)))
print(table)
======= ===================
measure value
======= ===================
max     35.48713664454108
mean    34.98192172121767
dev     0.28183495874527975
min     34.50566109712368
#       50
======= ===================
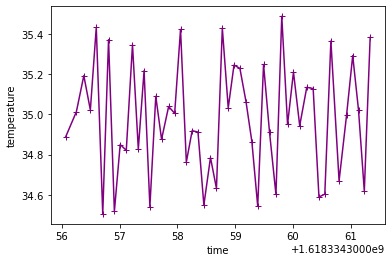
Let’s replot that data for comparison.
[8]:
dataset["temperature"].plot(marker="+", color="purple")
[8]:
[<matplotlib.lines.Line2D at 0x7fb18671baf0>]