Watch a temperature : scan temperature v time#
From APS Python Training for Bluesky Data Acquisition.
Objective
Measure the temperature for a short period and compute basics measures of the collected readings.
Start the instrument package#
Our instrument package is in the bluesky subdirectory here so we add that to the search path before importing it.
[1]:
import pathlib, sys
sys.path.append(str(pathlib.Path.home() / "bluesky"))
from instrument.collection import *
/home/prjemian/bluesky/instrument/_iconfig.py
Activating auto-logging. Current session state plus future input saved.
Filename       : /home/prjemian/Documents/projects/BCDA-APS/bluesky_training/docs/source/howto/.logs/ipython_console.log
Mode           : rotate
Output logging : True
Raw input log  : False
Timestamping   : True
State          : active
I Thu-17:54:44 - ############################################################ startup
I Thu-17:54:44 - logging started
I Thu-17:54:44 - logging level = 10
I Thu-17:54:44 - /home/prjemian/bluesky/instrument/session_logs.py
I Thu-17:54:44 - /home/prjemian/bluesky/instrument/collection.py
I Thu-17:54:44 - CONDA_PREFIX = /home/prjemian/.conda/envs/bluesky_2023_2
Exception reporting mode: Minimal
I Thu-17:54:44 - xmode exception level: 'Minimal'
I Thu-17:54:44 - /home/prjemian/bluesky/instrument/mpl/notebook.py
I Thu-17:54:44 - #### Bluesky Framework ####
I Thu-17:54:44 - /home/prjemian/bluesky/instrument/framework/check_python.py
I Thu-17:54:44 - /home/prjemian/bluesky/instrument/framework/check_bluesky.py
I Thu-17:54:44 - /home/prjemian/bluesky/instrument/framework/initialize.py
I Thu-17:54:44 - RunEngine metadata saved in directory: /home/prjemian/Bluesky_RunEngine_md
I Thu-17:54:44 - using databroker catalog 'training'
I Thu-17:54:44 - using ophyd control layer: pyepics
I Thu-17:54:44 - /home/prjemian/bluesky/instrument/framework/metadata.py
I Thu-17:54:44 - /home/prjemian/bluesky/instrument/epics_signal_config.py
I Thu-17:54:44 - Using RunEngine metadata for scan_id
I Thu-17:54:44 - #### Devices ####
I Thu-17:54:44 - /home/prjemian/bluesky/instrument/devices/area_detector.py
I Thu-17:54:44 - /home/prjemian/bluesky/instrument/devices/calculation_records.py
I Thu-17:54:47 - /home/prjemian/bluesky/instrument/devices/fourc_diffractometer.py
I Thu-17:54:47 - /home/prjemian/bluesky/instrument/devices/ioc_stats.py
I Thu-17:54:47 - /home/prjemian/bluesky/instrument/devices/kohzu_monochromator.py
I Thu-17:54:47 - /home/prjemian/bluesky/instrument/devices/motors.py
I Thu-17:54:47 - /home/prjemian/bluesky/instrument/devices/noisy_detector.py
I Thu-17:54:47 - /home/prjemian/bluesky/instrument/devices/scaler.py
I Thu-17:54:48 - /home/prjemian/bluesky/instrument/devices/shutter_simulator.py
I Thu-17:54:48 - /home/prjemian/bluesky/instrument/devices/simulated_fourc.py
I Thu-17:54:48 - /home/prjemian/bluesky/instrument/devices/simulated_kappa.py
I Thu-17:54:48 - /home/prjemian/bluesky/instrument/devices/slits.py
I Thu-17:54:48 - /home/prjemian/bluesky/instrument/devices/sixc_diffractometer.py
I Thu-17:54:49 - /home/prjemian/bluesky/instrument/devices/temperature_signal.py
I Thu-17:54:49 - #### Callbacks ####
I Thu-17:54:49 - /home/prjemian/bluesky/instrument/callbacks/spec_data_file_writer.py
I Thu-17:54:49 - #### Plans ####
I Thu-17:54:49 - /home/prjemian/bluesky/instrument/plans/lup_plan.py
I Thu-17:54:49 - /home/prjemian/bluesky/instrument/plans/peak_finder_example.py
I Thu-17:54:49 - /home/prjemian/bluesky/instrument/utils/image_analysis.py
I Thu-17:54:49 - #### Utilities ####
I Thu-17:54:49 - writing to SPEC file: /home/prjemian/Documents/projects/BCDA-APS/bluesky_training/docs/source/howto/20230413-175449.dat
I Thu-17:54:49 -    >>>>   Using default SPEC file name   <<<<
I Thu-17:54:49 -    file will be created when bluesky ends its next scan
I Thu-17:54:49 -    to change SPEC file, use command:   newSpecFile('title')
I Thu-17:54:49 - #### Startup is complete. ####
Describe#
Note the initial settings of the temperature (controller). It’s actually an EPICS swait record that simulates a temperature sensor and controller. It has a setpoint, a readback, and a few other support attributes as shown. A Random noise level is part of the simulation. We’ll compute that noise level from the standard deviation of the measurements.
[2]:
listdevice(temperature)
[2]:
=============================== =================================== ==========================
data name                       value                               timestamp
=============================== =================================== ==========================
temperature_setpoint            25.0                                2023-04-13 17:54:49.157724
temperature                     0.0                                 2023-04-13 17:54:49.159466
temperature_done                False                               2023-04-13 17:54:49.178146
temperature_calculation         A+max(-D,min(D,(B-A)))+C*(RNDM-0.5) 2023-04-13 17:54:49.160429
temperature_description         temperature                         2023-04-13 17:54:49.154181
temperature_max_change          2.0                                 2023-04-13 17:54:49.160349
temperature_noise               1.0                                 2023-04-13 17:54:49.159466
temperature_previous_value_pv   gp:userCalc8.VAL                    2023-04-13 17:54:49.157188
temperature_scanning_rate       5                                   2023-04-13 17:54:49.160429
temperature_tolerance           1.0                                 2023-04-13 17:54:49.160429
temperature_report_dmov_changes False                               2023-04-13 17:54:49.156380
=============================== =================================== ==========================
Count#
Use the bluesky RunEngine, RE, and a standard plan, bp.count(), to count the temperature. The bp.count() plan triggers (typically a scaler) and then reads from the detector. In this case, the temperature device’s .trigger() method does not do anything, yet it is still countable.
[3]:
RE(bp.count([temperature]))
Transient Scan ID: 958     Time: 2023-04-13 17:54:49
Persistent Unique Scan ID: 'cd24d583-6fd9-43ce-9ea3-583b104c2a6d'
New stream: 'label_start_motor'
New stream: 'primary'
+-----------+------------+-------------+
|   seq_num |       time | temperature |
+-----------+------------+-------------+
|         1 | 17:54:49.4 |     0.00000 |
+-----------+------------+-------------+
generator count ['cd24d583'] (scan num: 958)
[3]:
('cd24d583-6fd9-43ce-9ea3-583b104c2a6d',)
Take ten readings by adding the num=10 keyword argument (a.k.a. kwarg).
[4]:
RE(bp.count([temperature], num=10))
Transient Scan ID: 959     Time: 2023-04-13 17:54:49
Persistent Unique Scan ID: '8b99ba9a-1361-4b5d-8910-3a7b1e0566e2'
New stream: 'label_start_motor'
New stream: 'primary'
+-----------+------------+-------------+
|   seq_num |       time | temperature |
+-----------+------------+-------------+
|         1 | 17:54:49.8 |     0.00000 |
|         2 | 17:54:49.8 |     0.00000 |
|         3 | 17:54:49.8 |     0.00000 |
|         4 | 17:54:49.9 |     2.24478 |
|         5 | 17:54:49.9 |     2.24478 |
|         6 | 17:54:49.9 |     2.24478 |
|         7 | 17:54:50.0 |     2.24478 |
|         8 | 17:54:50.0 |     2.24478 |
|         9 | 17:54:50.0 |     2.24478 |
|        10 | 17:54:50.0 |     2.24478 |
+-----------+------------+-------------+
generator count ['8b99ba9a'] (scan num: 959)
[4]:
('8b99ba9a-1361-4b5d-8910-3a7b1e0566e2',)
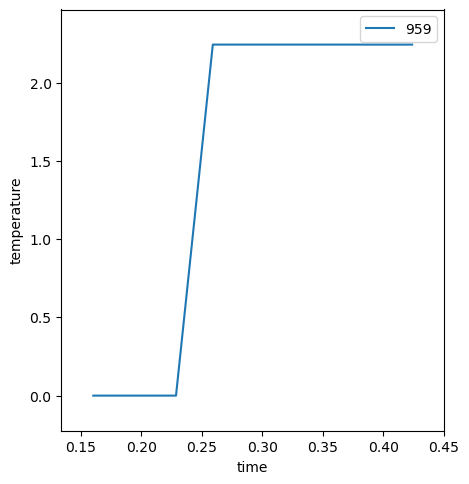
Do all the readings look the same? Perhaps there are only two different values (first one, then the other)? That’s because our measurements were only reading the temperature without waiting for it to update. (If there are two different values, we caught the moment when EPICS updated the calculation.) The table above showed temperature_scanning_rate 5 which means EPICS is only updating every 2 seconds.
[5]:
temperature.scanning_rate.get(as_string=True)
[5]:
'2 second'
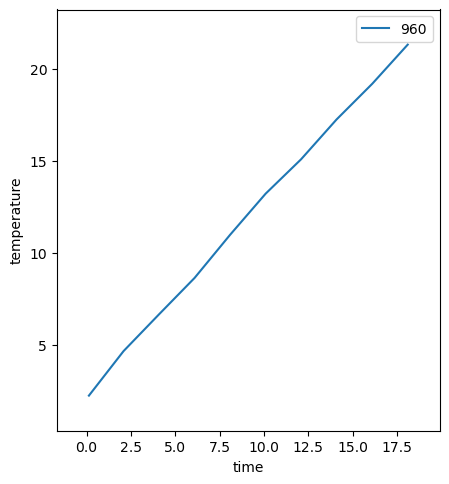
Adjust the measurement interval#
We need to slow down the measurement to this interval by adding the delay=2 kwarg, sampling every 2 seconds.
[6]:
RE(bp.count([temperature], num=10, delay=2))
Transient Scan ID: 960     Time: 2023-04-13 17:54:50
Persistent Unique Scan ID: 'b55776f1-0a02-464c-9762-fe807c90c014'
New stream: 'label_start_motor'
New stream: 'primary'
+-----------+------------+-------------+
|   seq_num |       time | temperature |
+-----------+------------+-------------+
|         1 | 17:54:50.6 |     2.24478 |
|         2 | 17:54:52.6 |     4.66694 |
|         3 | 17:54:54.6 |     6.66461 |
|         4 | 17:54:56.6 |     8.64790 |
|         5 | 17:54:58.6 |    10.99491 |
|         6 | 17:55:00.6 |    13.23049 |
|         7 | 17:55:02.6 |    15.09944 |
|         8 | 17:55:04.6 |    17.26870 |
|         9 | 17:55:06.6 |    19.20524 |
|        10 | 17:55:08.6 |    21.33919 |
+-----------+------------+-------------+
generator count ['b55776f1'] (scan num: 960)
[6]:
('b55776f1-0a02-464c-9762-fe807c90c014',)
Let’s reduce the update interval that EPICS uses, to the shortest interval EPICS provides, so our measurements do not take so long.
[7]:
# print the list of possible values
print(temperature.scanning_rate.enum_strs)

# set the shortest interval, by name
temperature.scanning_rate.put(".1 second")
temperature.scanning_rate.get(as_string=True)
('Passive', 'Event', 'I/O Intr', '10 second', '5 second', '2 second', '1 second', '.5 second', '.2 second', '.1 second')
[7]:
'2 second'
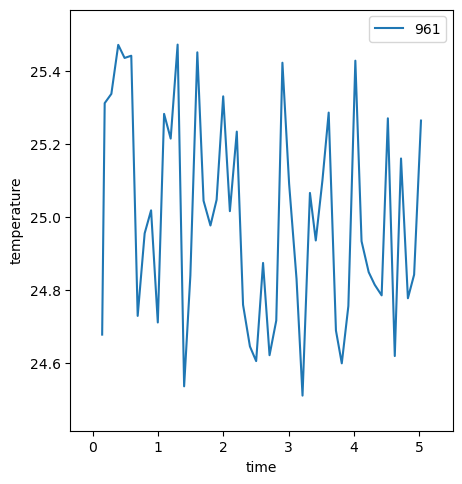
Collect our measurements#
Repeat the measurement, this time with more observations.
Also, we’ll add a metadata key:value pair so that later we can find this data more easily in the database. Most plans take a md={} kwarg where the value is a Python dictionary with the key:value pair(s) to add to the run’s metadata.
[8]:
RE(bp.count([temperature], num=50, delay=0.1, md={"motive": "tscan"}))
Transient Scan ID: 961     Time: 2023-04-13 17:55:11
Persistent Unique Scan ID: '51779bd1-f506-4622-8a89-f6002f281de4'
New stream: 'label_start_motor'
New stream: 'primary'
+-----------+------------+-------------+
|   seq_num |       time | temperature |
+-----------+------------+-------------+
|         1 | 17:55:11.1 |    24.67653 |
|         2 | 17:55:11.2 |    25.31126 |
|         3 | 17:55:11.3 |    25.33679 |
|         4 | 17:55:11.4 |    25.47115 |
|         5 | 17:55:11.5 |    25.43527 |
|         6 | 17:55:11.6 |    25.44133 |
|         7 | 17:55:11.7 |    24.72783 |
|         8 | 17:55:11.8 |    24.95423 |
|         9 | 17:55:11.9 |    25.01724 |
|        10 | 17:55:12.0 |    24.70978 |
|        11 | 17:55:12.1 |    25.28183 |
|        12 | 17:55:12.2 |    25.21415 |
|        13 | 17:55:12.3 |    25.47186 |
|        14 | 17:55:12.4 |    24.53467 |
|        15 | 17:55:12.5 |    24.83840 |
|        16 | 17:55:12.6 |    25.45067 |
|        17 | 17:55:12.7 |    25.04357 |
|        18 | 17:55:12.8 |    24.97578 |
|        19 | 17:55:12.9 |    25.04635 |
|        20 | 17:55:13.0 |    25.32997 |
|        21 | 17:55:13.1 |    25.01504 |
|        22 | 17:55:13.2 |    25.23326 |
|        23 | 17:55:13.3 |    24.75829 |
|        24 | 17:55:13.4 |    24.64411 |
|        25 | 17:55:13.5 |    24.60384 |
|        26 | 17:55:13.6 |    24.87308 |
|        27 | 17:55:13.7 |    24.62004 |
|        28 | 17:55:13.8 |    24.71509 |
|        29 | 17:55:13.9 |    25.42215 |
|        30 | 17:55:14.0 |    25.08979 |
|        31 | 17:55:14.1 |    24.82930 |
|        32 | 17:55:14.2 |    24.50919 |
|        33 | 17:55:14.3 |    25.06507 |
|        34 | 17:55:14.4 |    24.93471 |
|        35 | 17:55:14.5 |    25.09922 |
|        36 | 17:55:14.6 |    25.28540 |
|        37 | 17:55:14.7 |    24.68781 |
|        38 | 17:55:14.8 |    24.59773 |
|        39 | 17:55:14.9 |    24.75489 |
|        40 | 17:55:15.0 |    25.42776 |
|        41 | 17:55:15.1 |    24.93259 |
|        42 | 17:55:15.2 |    24.84777 |
|        43 | 17:55:15.3 |    24.81318 |
|        44 | 17:55:15.4 |    24.78414 |
|        45 | 17:55:15.5 |    25.26970 |
|        46 | 17:55:15.6 |    24.61772 |
|        47 | 17:55:15.7 |    25.15956 |
|        48 | 17:55:15.8 |    24.77626 |
|        49 | 17:55:15.9 |    24.84089 |
+-----------+------------+-------------+
|   seq_num |       time | temperature |
+-----------+------------+-------------+
|        50 | 17:55:16.0 |    25.26352 |
+-----------+------------+-------------+
generator count ['51779bd1'] (scan num: 961)
[8]:
('51779bd1-f506-4622-8a89-f6002f281de4',)
Get the data (from the database)#
Let’s get the measured data from the database now. It’s the most recent bluesky run, so an index of -1 will identify it.
[9]:
dataset = cat[-1].primary.read()
Let’s get the values as a 1-D numpy array.
[10]:
T = dataset["temperature"].values
Compute the statistics#
Use the methods of numpy arrays to compute maximum, mean, standard deviation, and minimum. Looks nicer in a table.
[11]:
import pyRestTable

table = pyRestTable.Table()
table.addLabel("measure")
table.addLabel("value")
table.addRow(("max", T.max()))
table.addRow(("mean", T.mean()))
table.addRow(("dev", T.std()))
table.addRow(("min", T.min()))
table.addRow(("#", len(T)))
print(table)
======= ==================
measure value
======= ==================
max     25.471862363622492
mean    24.994794842450602
dev     0.2892339831470962
min     24.50918593118181
#       50
======= ==================
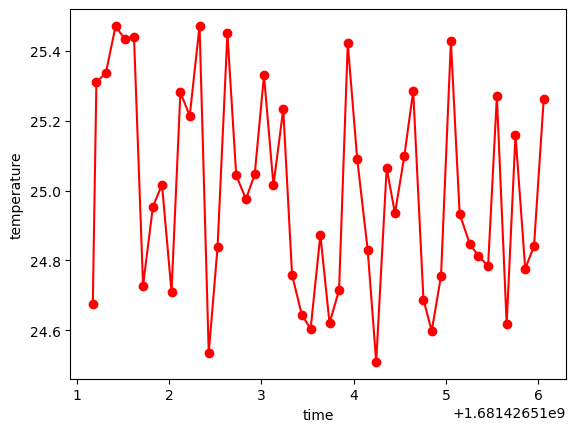
Let’s replot that data for comparison.
[12]:
dataset["temperature"].plot(marker="o", color="red")
[12]:
[<matplotlib.lines.Line2D at 0x7f6b49565bd0>]